After three negative months of returns, US equity investors began November with a strong Follow-Through Day (FTD) on November 2, 2023, when the S&P 500 rose 1.9% on higher daily volume. O’Neil Global Advisors (OGA) defines a FTD as a:
- Daily gain on a major country benchmark that is >1.7% on at least the fourth day after market lows have been established, and
- On volume higher than the prior day.
Conversely, OGA defines a negative Distribution Day as a daily loss of -0.2% or more on volume higher than the prior day.
Though a successful FTD is only apparent in retrospect, we are hopeful that the recent market gains will mark the end of the decline in the market and the start of a new longer-term bull. This is driven by the possibility that the Fed has ended its tightening cycle and US long-term interest rates have peaked. In addition, US corporate profits improved on a year-to-year basis in the recently completed third quarter.
While not every FTD translates to strong forward gains, each significant market rally tends to begin with a FTD. Keys to success for a FTD include immediate price gains and minimal distribution days in the following days and weeks, positive behavior in group and stock leadership, and the emergence of new leadership stocks and groups. On the other hand, FTDs that fail tend to have signs of struggle including multiple distribution days shortly thereafter, and failure of market leadership to make significant headway.
Three timeless quotes from our founder William J. O’Neil illustrate our investment philosophy regarding FTDs.
“A FTD should give the feeling of an explosive rally that is strong, decisive, and conclusive—not begrudgingly or on the fence.”
“…the first thing I learned about how to get superior performance is not to buy stocks that are near their lows, but to buy stocks that are coming out of broad bases and beginning to make new highs.”
“My philosophy is that all stocks are bad. There are no good stocks unless they go up in price. If they go down instead, you must cut your losses fast. Letting losses run is the most serious mistake made by most investors.
The first two quotes are especially relevant now that we have had FTDs in many global markets, including in the US. The second speaks to the profile of stocks we are currently interested in buying. The last quote relates to markets like the July–October 2023 period where the general market is down (-11% for the S&P 500) and the median stock down much more significantly (median stock was more than 30% off 52-week highs to October lows). This will continue to be relevant going forward: stocks that falter if general market strength continues are strong candidates to reduce or sell.
Keys to the US Rally
The two key requirements to make this a sustainable rally are FTDs and seeing breadth in the market. Here are more details on both these requirements.
1) FTD on major indices
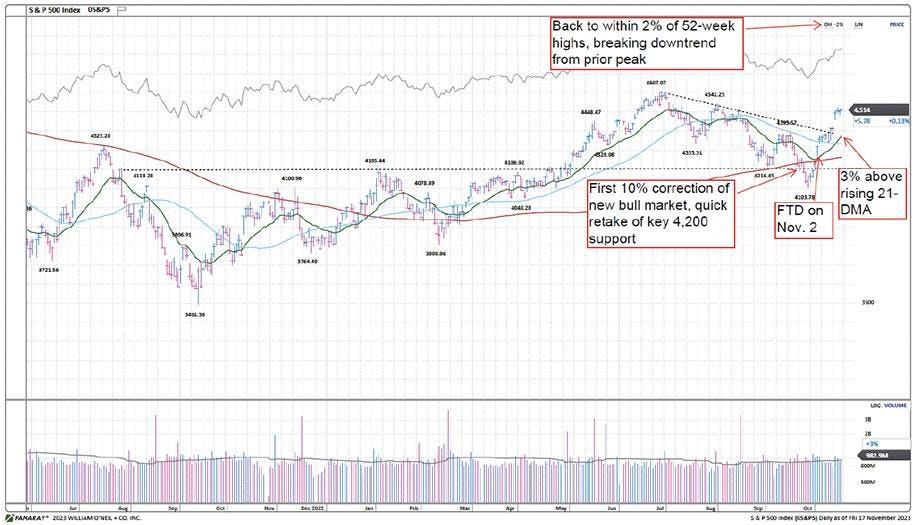
- In the US, the S&P 500 and Nasdaq Composite indices generated FTDs on November 2.
- Interestingly, these were preceded by FTDs on small- and mid-cap Russell indices on November 1.
- Volume on each of the indices was well above the prior day in each case, giving a conclusive feel.
- Additionally, this past week each index generated a secondary FTD early in the week, with an even more conclusive feel. Indices rose between 2.5% – 5.5% on the day on well above average volume. This touches on a key for a sustainable rally post-FTD, which is making ground in the following days and weeks. This can be seen on the market Datagraphs™ below*.
Figure 1: S&P 500 Daily Chart
Figure 2: Nasdaq Composite Daily Chart
Figure 3: Russell 2000 Daily Chart
It is key to have strong participation of leaders in the wake of a FTD. Certainly, this has been true this month with the strong performance of these industry groups (noting representative ETFs): Software (IGV), Cyber Security (HACK), Semiconductors (SOXX), Infrastructure (PAVE), Housing/Related (XHB), and Aerospace/Defense (PPA). Also, smaller groups like steel, apparel, education, and electrical are firmly in the leadership category. These are illustrated in the charts below:
Figure 4: Leading Groups Charts
Other groups coming from a worse position, but sharply improving recently, include ETFs that invest in hyper-growth stocks (ARKK
ARKK
IPAY
IBUY
KRE
2) Breadth of Market & Breakouts
The second requirement to this rally sustaining itself is a positive technical signal that the stock market breadth has improved dramatically. This is shown on the Datagraph below that measures the percentage of stocks on the New York Stock Exchange trading above their 30-Week Moving Average. This measure had fallen to 18% during the correction but has now risen to over 42%.
Figure 5: % of Stocks Above 30-WMA on NYSE-Weekly Chart
Similarly, stocks emerging from a consolidation period or base have also risen on our proprietary Breakout measure. After four months of below-average totals of Breakouts, the week ended November 17, 2023, the Breakout totals spiked once again. Historically, new bull markets are accompanied by a large increase in Breakouts.
Figure 6: Weekly US Stock Breakouts
By sector, here are the proportions of recent Breakouts. Technology, Retail, Capital Equipment, and Consumer Cyclical have outsized proportions while Health Care and Energy are the least represented.
Figure 7: Recent Breakouts by Sector
As previously mentioned, two of the drivers of a possible market turn are corporate earnings and US interest rates. The 3Q23 corporate earnings reporting season saw a normal percentage of earnings beats, though positive post-earnings price action was much stronger than in the last quarter. We are encouraged to see the rally take shape throughout this earnings season.
Signals from interest rates are also constructive. It appears likely that US 10-year rates have hit their peak. We may be entering the sweet spot of the interest rate cycle where the Fed pauses but does not necessarily cut rates.
Figure 8: US 10-yr Notes-Weekly Chart
A final positive indicator is that global markets have participated in the November push higher:
- Sixteen of 24 developed markets that we track at O’Neil have had FTDs within the past two weeks. These include key markets like Japan, France, Germany, Spain, Hong Kong, and Canada.
- Seven of 25 emerging markets that we track have had FTDs within the past three weeks. These include Brazil, Mexico, Korea, and South Africa. Markets in Taiwan and India have gained strength but have yet to have a FTD, while China remains the key weak spot, only slightly off October lows.
Some of the global leaders that are investable via USD ETFs include Japan (EWJ
EWJ
EWG
EWP
EWI
INDA
EWT
EPOL
EWZ
Figure 9: Leading International Markets – Weekly Charts (USD ETFs)
In conclusion, we will not know until we are able to look back if this recent upward move is the start of a new trend. At this point, we would cautiously add capital to the equity market and remain alert for signs of progress at the overall market level, as well as at the industry group and individual stock level. Also, we want to be cognizant of a possible failure of the November 2, 2023, FTD. This would manifest itself with an undercut of the FTD low (4,268), which is also exactly the 200-DMA right now. If this occurs, we would urge reducing positions and the overall amount of capital committed to US stocks.
*Note: all data in charts and tables throughout this article are as of November 17, 2023
Read the full article here


